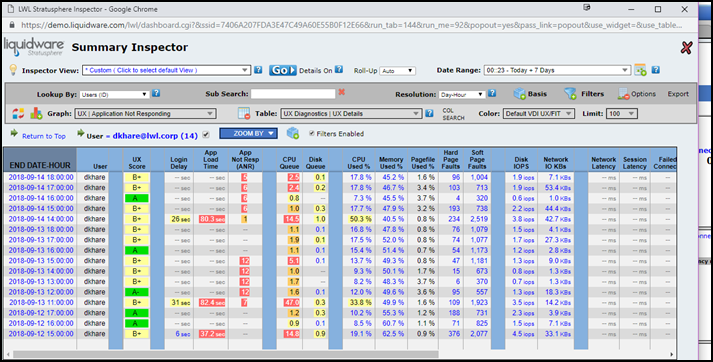
Locating the Trends & Top Consumers Views
To view the Advanced Mode Trends & Top Consumers Dashboards screen, complete the following steps:
- Open Stratusphere and click the Advanced tab at the top of the screen.
- Click the Trends & Top Consumers sub-tab.
-

- The Overview Trend, Compare Trend, and Top Consumers dashboards then appear on the screen.
-
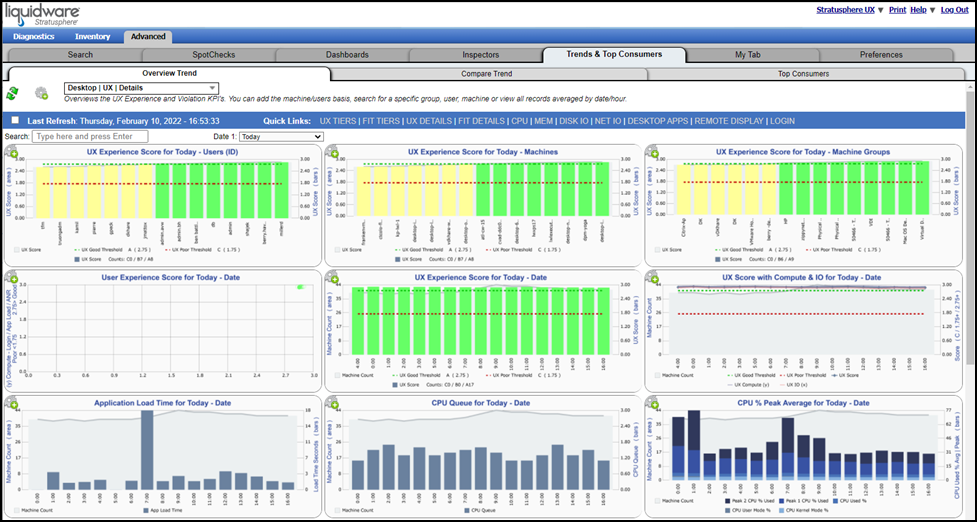
Overview of Trends & Top Consumers Dashboards
The Advanced Mode Trends & Top Consumers dashboards contain three tabs, each providing a different view of the Stratusphere UX metrics. The following trend tabs are included:
-
Overview Trend
-
Compare Trend
-
Top Consumers
Overview Trend
The first dashboard tab, Overview Trend, displays a single view determined by the date, basis, and resolution defined in the dashboard controls.
Tip: Clicking the gear icon in the top left corner of the view opens the dashboard controls. Widget settings can be defined here, including the timeframe (date/time) and resolution of the overall dashboard view.

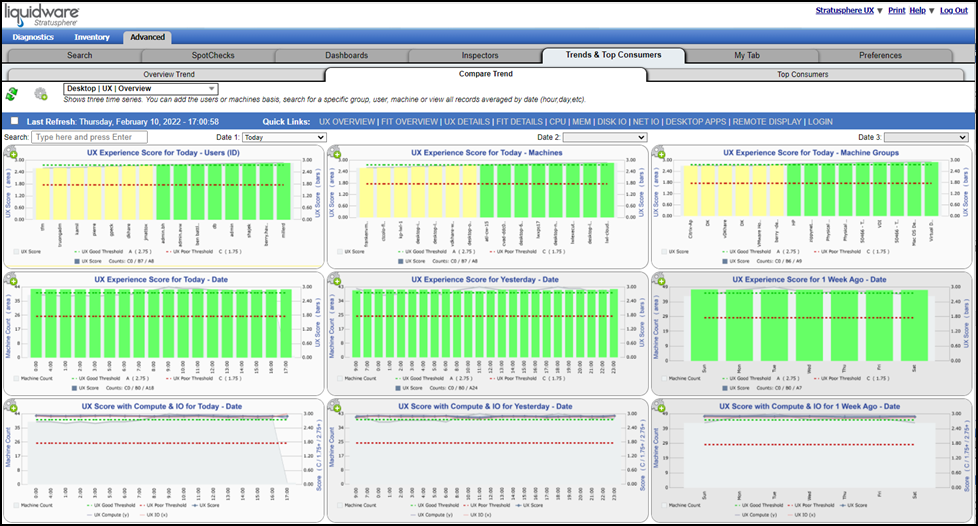
Compare Trend
The next dashboard tab, Compare Trend, displays three time views, each of which can be tailored from within the dashboard controls to show a different date, basis, and resolution.
Top Consumers
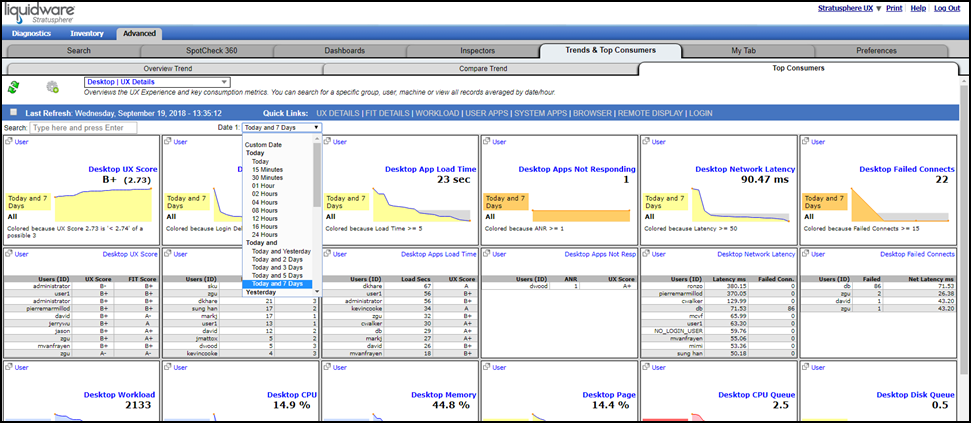
The third dashboard tab, Top Consumers, displays key user experience and trend metrics in a single view. Specific details are depicted as a series of sparkline graphs and tables averaged by date/hour.
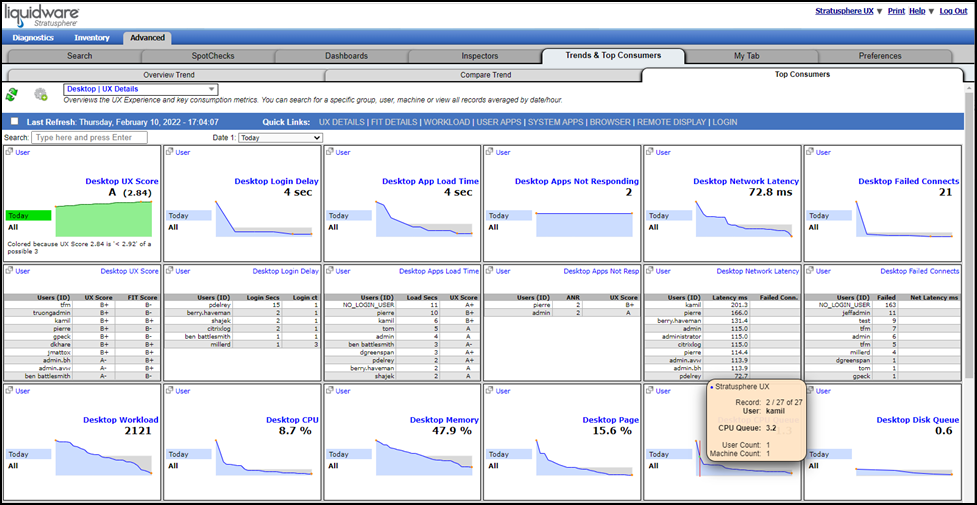
Navigating the Trends & Top Consumers Views
Each of the three dashboard tabs—Overview Trend, Compare Trend, and Top Consumers—has similar features and functionality.
Dashboard Interface
All dashboard widgets can be refreshed to the most current metrics collected by the Stratusphere Connector ID Key (CID Key) by clicking the ![]() (Refresh) icon in the top left corner of the screen. Additionally, you can have the data and metrics provided in the widgets auto-refresh every 15 minutes by selecting the checkbox that appears to the left of the words Last Refresh under the Refresh icon.
(Refresh) icon in the top left corner of the screen. Additionally, you can have the data and metrics provided in the widgets auto-refresh every 15 minutes by selecting the checkbox that appears to the left of the words Last Refresh under the Refresh icon.

Quick Links are provided to make it easier to access frequently needed dashboard views used for support monitoring and diagnostics use cases.
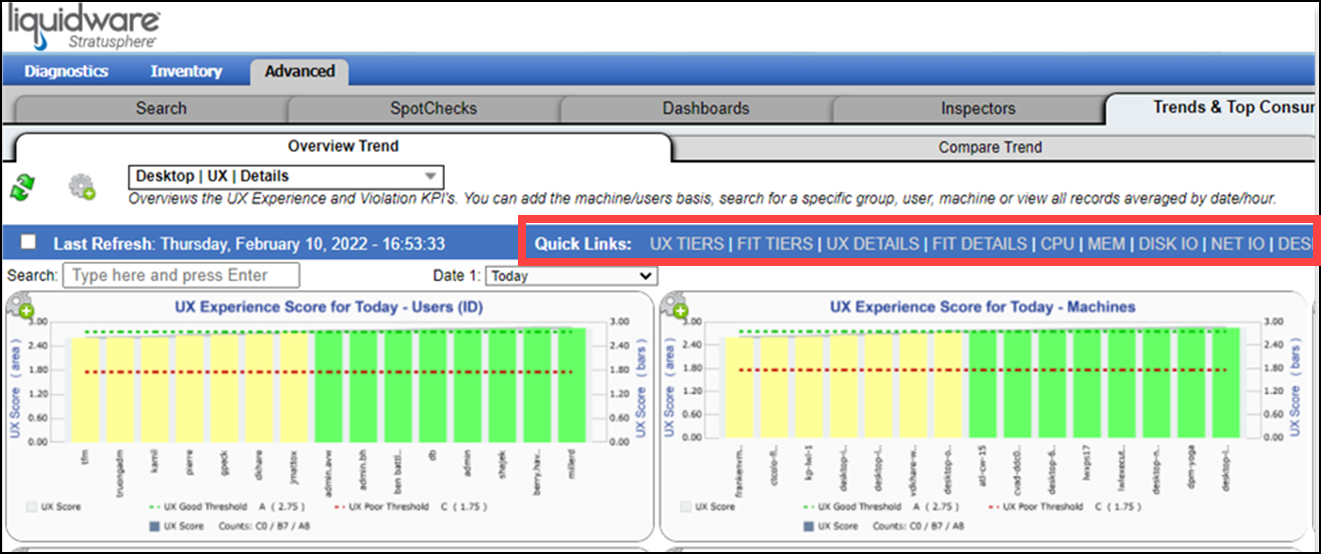
Search, Time and Date
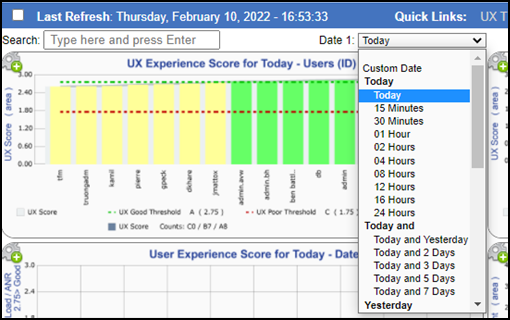
You can change the focus of the dashboard and search for specific users, machines, or machine groups from the Search box located at the top of the screen. You can also use the Date 1 drop-down list to quickly and easily select a date and timeframe for your query.
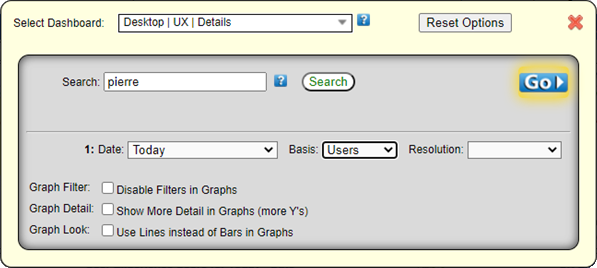
Dashboard Controls and Menus
Dashboard Controls can be set for each tab view by clicking the ![]() (Settings) icon at the top of the tab. These controls are context-aware based on the dashboard type and the features available within and they persist for each monitoring and diagnostics setting. Some defaults can be set in the Preferences tab. Refer to the Preferences section of the Stratusphere UX Quick Start Guide for more details.
(Settings) icon at the top of the tab. These controls are context-aware based on the dashboard type and the features available within and they persist for each monitoring and diagnostics setting. Some defaults can be set in the Preferences tab. Refer to the Preferences section of the Stratusphere UX Quick Start Guide for more details.
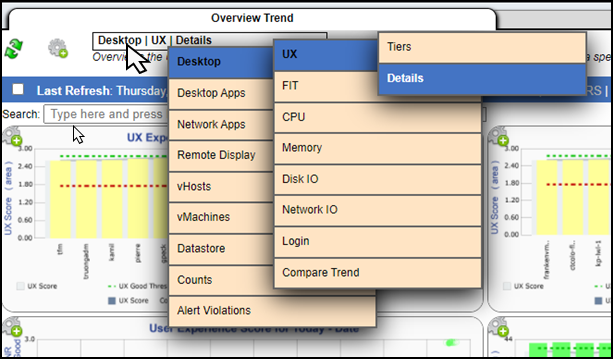
If you hover your cursor over the context-aware menu, a series of built-in monitoring and diagnostics dashboard views appears.
Graph Controls
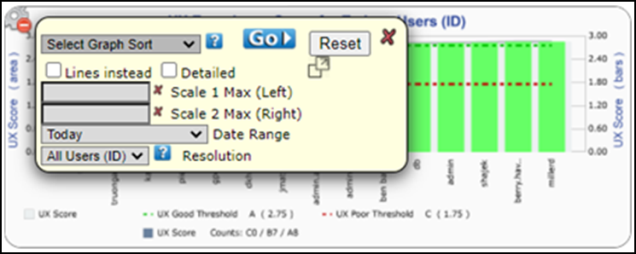
Each widget on the Overview Trend and Compare Trend dashboards provides individual controls via the Graph Control which opens when you click the ![]() (Settings) icon in the top left corner of each graph.
(Settings) icon in the top left corner of each graph.
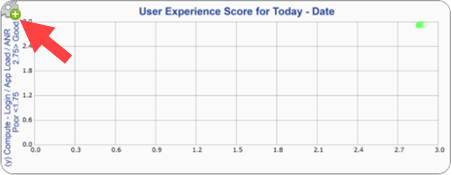
In addition to being able to configure graph settings and set different date/time ranges and resolutions, you can also launch the Advanced Mode Inspector window from here by clicking the ![]() (Pop-up) icon under the Reset button.
(Pop-up) icon under the Reset button.
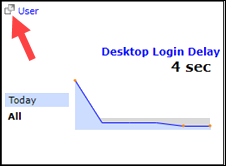
You can also open the Advanced Mode Inspector view from within the Top Consumers sparkline graphs by clicking an identical ![]() (Pop-up) icon in the top left corner of each widget.
(Pop-up) icon in the top left corner of each widget.
Trends & Top Consumers Use Cases
Overview Trend and Compare Trend Use Case Example
The Overview Trend and Compare Trend tabs are a great place to begin a helpdesk or diagnostic exercise. For example, in the Quick Link bar at the top of the Overview Trend tab, click the MEM link.

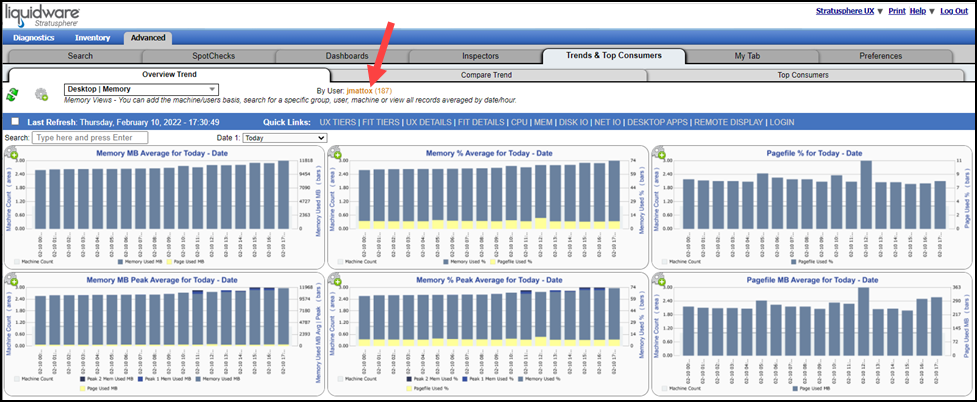
The Dashboard then displays Memory MB, Memory %, and Pagefile averages for the selected timeframe (Today).
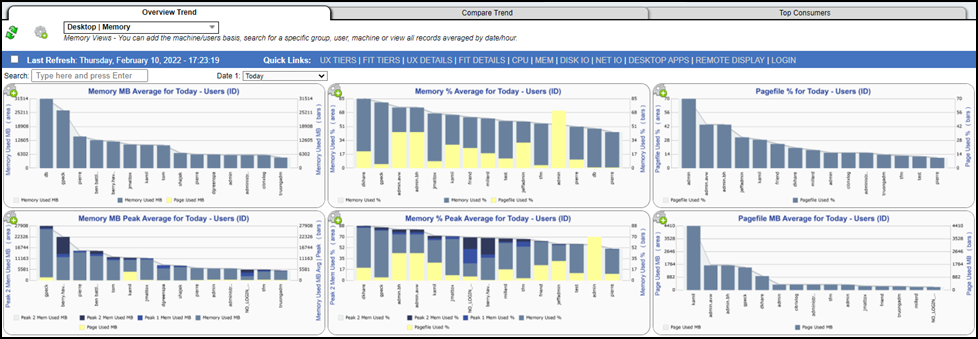
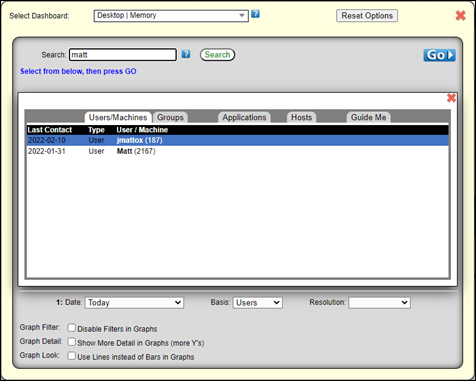
This tab allows you to change the timeframe and focus on a specific user to diagnose problems that they are having. So, for example, if user Mattox has called into the helpdesk and you suspect a memory-related issue, you can view their specific details. Open the Dashboard Controls by clicking the ![]() (Settings) icon at the top of the tab. Then type matt into the Search box on the Dashboard Controls tab, press Enter on your keyboard, select user jmattox in the search results, then click the Go button in the top right corner of the screen.
(Settings) icon at the top of the tab. Then type matt into the Search box on the Dashboard Controls tab, press Enter on your keyboard, select user jmattox in the search results, then click the Go button in the top right corner of the screen.
The dashboard then refreshes to show details for the most recent hours for user jmattox (187).
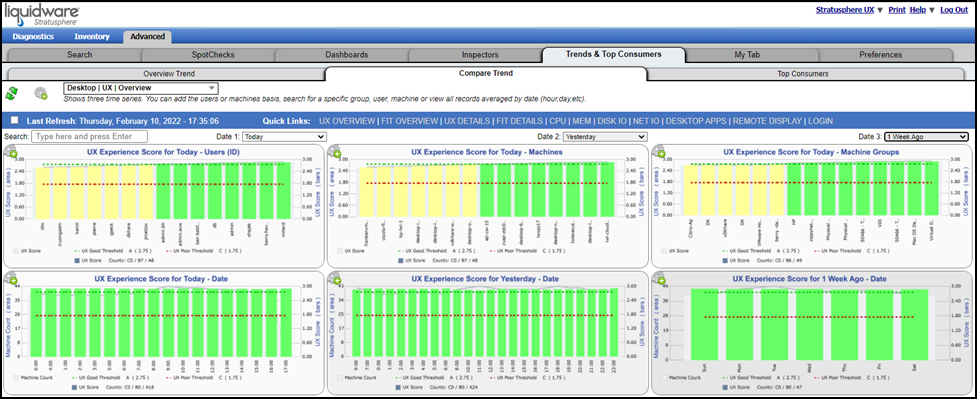
If you want to see how user jmattox consumed different resources over time, click the Compare Trend dashboard tab and enter jmattox in the Search field. You are then provided with three timeframe views for this user. You can use the Date drop-down menus at the top of each widget to display different time spans. For example, you can set the second column to Yesterday and the third column to 1 Week Ago.
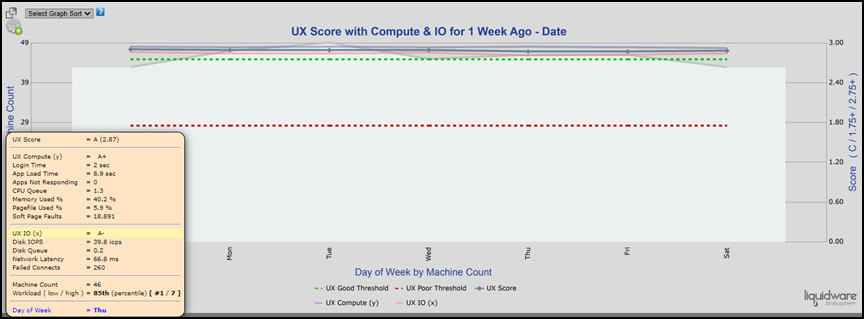
If you want more details about a timeframe while gaining the ability to see details in a popup box, click any dashboard widget. In the image below, for example, you can see that user jmattox ranked above “Good” in compute and IO performance over the previous week. In addition, the popup box shows that his user Experience IO rating was an A- on Wednesday.
Top Consumers Use Case Example
The Top Consumers tab offers trend views with complimentary sparkline and table widgets. All views are based on the top 1,000 consumers (worst users, machines, or machine groups). Each displayed sparkline metric is averaged over the depicted timeframe, with 168 data points shown. For example, run a search for user DK to see his application use over the past week. Enter DK in the search field, select the timeframe, and then select Desktop Apps > User Owned from the menu.
Hover over the context-aware menu to select the Desktop Apps view.
Hover details show that user DK had several applications that were non-responsive during the selected time span.
![]()
To see more detail about the applications running for this user during this time period, click the ![]() (Pop-up) icon to access the Advanced Mode Inspector view.
(Pop-up) icon to access the Advanced Mode Inspector view.
You can then see the specific day-hour when non-responding applications and other resource constraints occurred over the same time and date window.
