Being able to understand and identify issues around the complex process of the user login is an important task for IT administrators. As the desktop is being set up for the user, there are a lot of individual operations occurring at login. If any operation fails or if there is a bottleneck, a user can experience significant delays. When users report slow logins, it is important to find the source of the problem. In addition, being able to proactively identify these is growing more important.
Stratusphere provides detailed event tracing of the Windows login process by measuring and reporting on items like the following:
- Boot Delay
- Login Delay
- Domain Controller Access
- Computer and User GPOs
- GPO client extension names and load times
- Roaming Profile load times
- Time to Restore Network Connections and processes that start and end between each step of the login process
You can trend this information for the user, machine, or a pool level by using machine groups.
Capturing all of the login details is an optional setting you can turn on when you configure your Connector ID Keys. Refer to the Stratusphere Installation and Configuration Guide for more details.
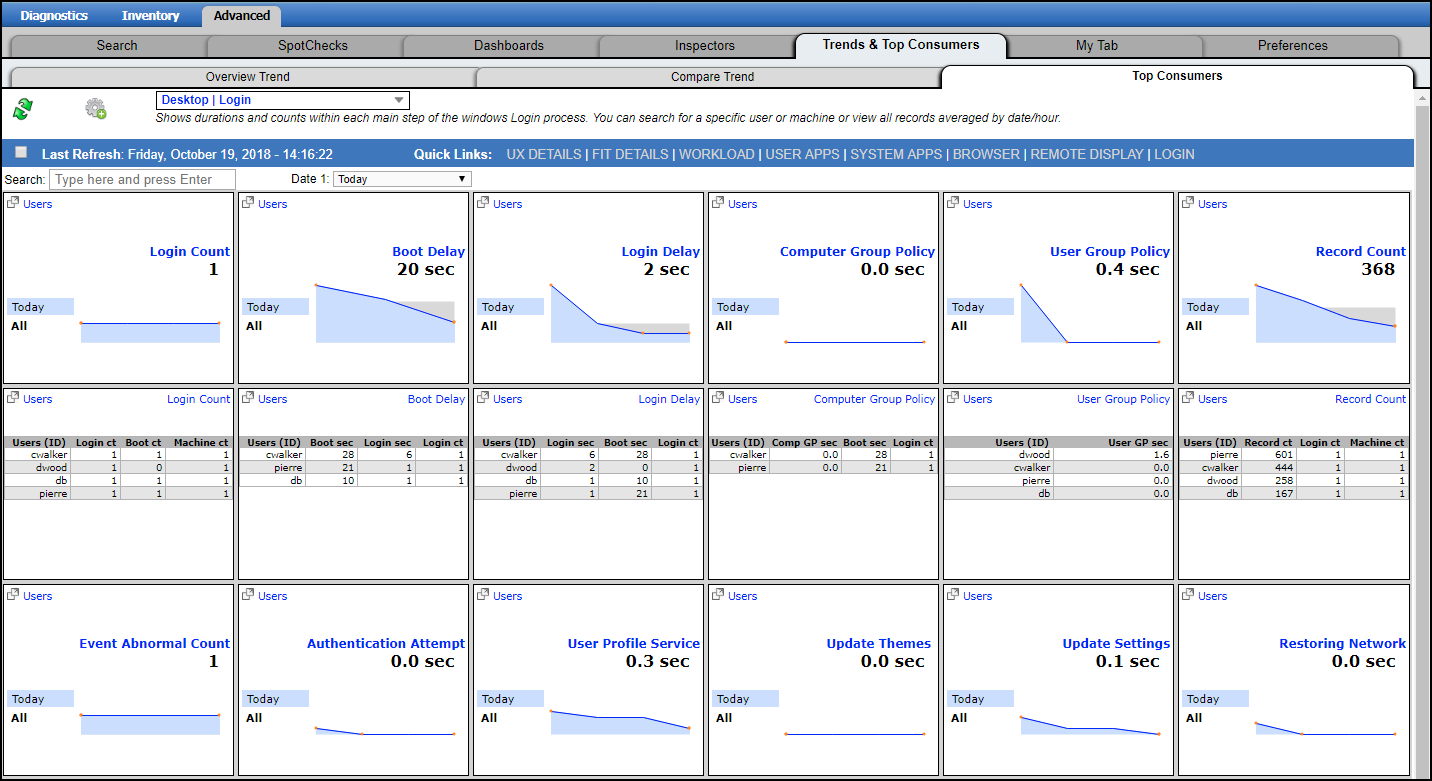
After the CID Keys in your environment are returning login data, you can use the Advanced Inspectors to provide more data on the login process breakdown. A great place to start is with an overview of logins in your environment. From the Advanced > Trends & Top Consumers > Top Consumers tab, click the ![]() (Gear) icon to select the Desktop > Login dashboard.
(Gear) icon to select the Desktop > Login dashboard.
The Login sparkline dashboard shows the duration and counts of each main step of the Windows login process. You can search for a specific user or machine or view all records averaged by date/hour.
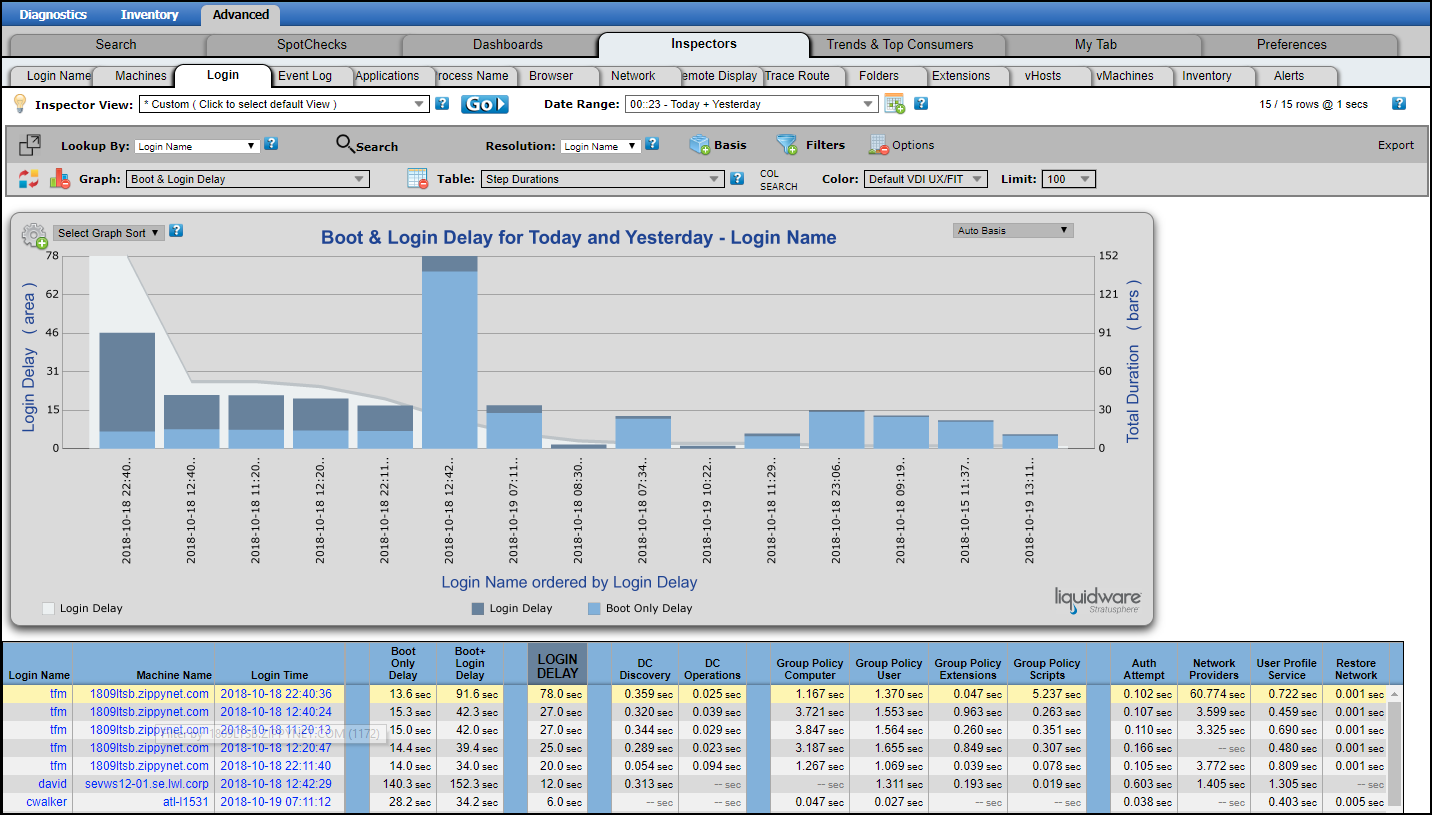
From the Advanced > Inspectors > Login tab you can see a Boot and Login delay for your users.
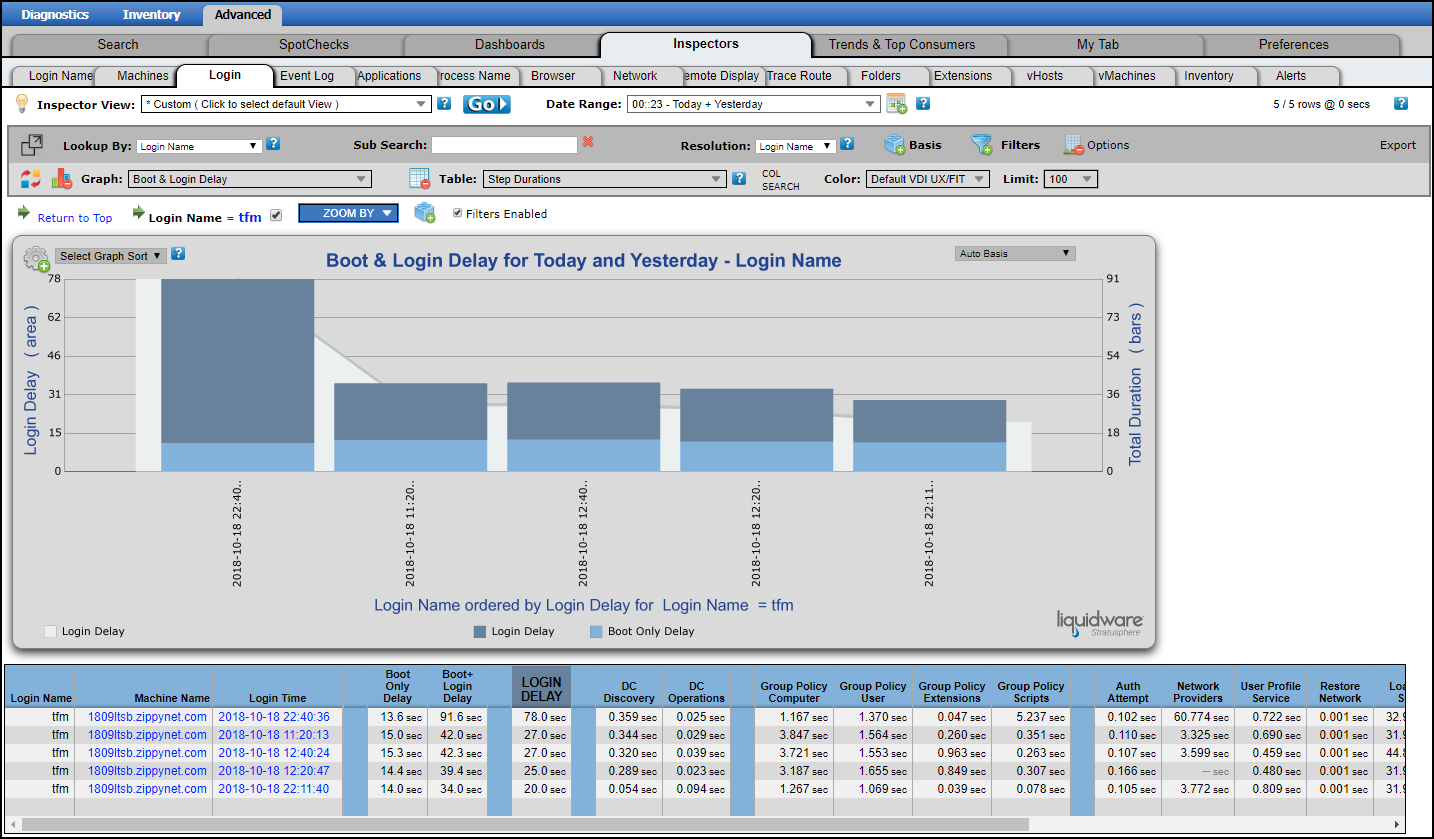
To drill down to a specific user, click the user’s name in the chart. At this point you still see an overview, but it is isolated to just this user.
Click the specific login time that you want to drill down into. Each login within the time period selected will be listed. To change the time span, select a different Date Range from the drop-down menu at the top of the tab. Drilling down into a specific login will list each main step of the login process showing the duration and highlighting errors.
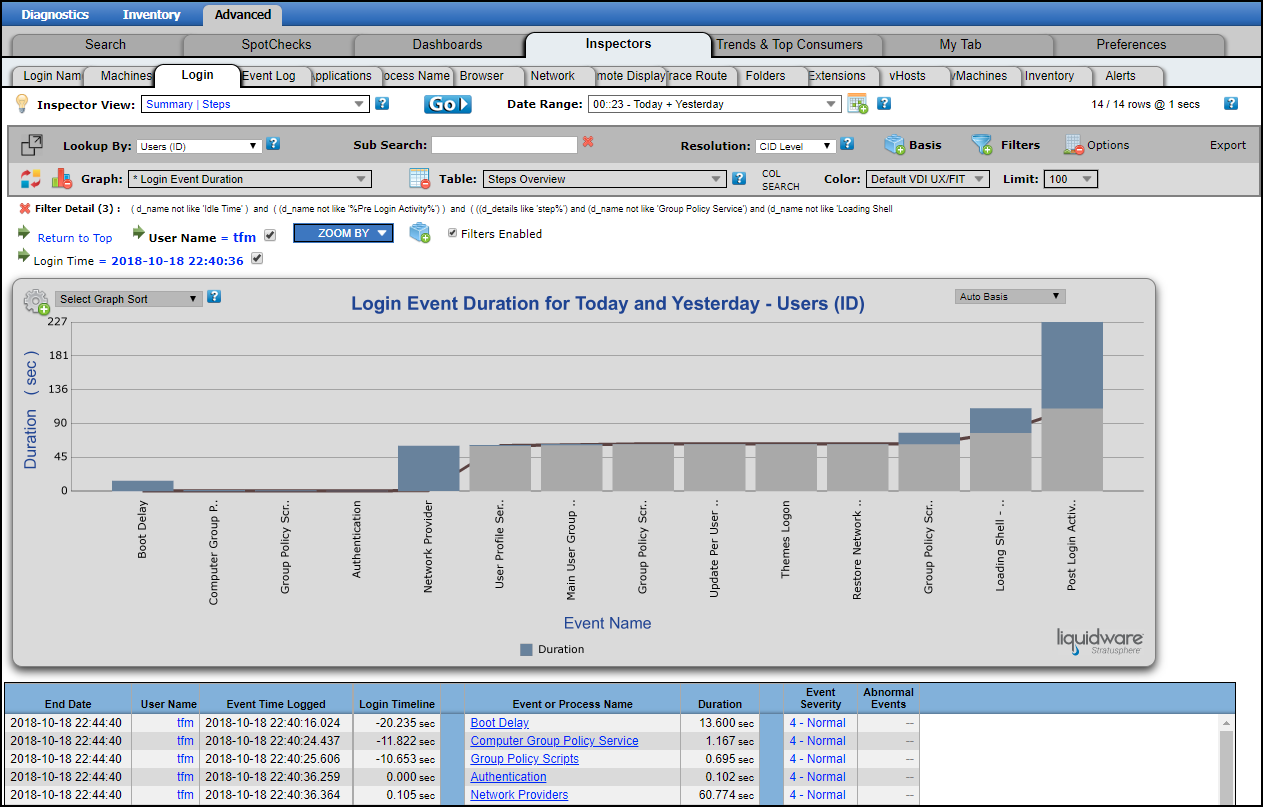
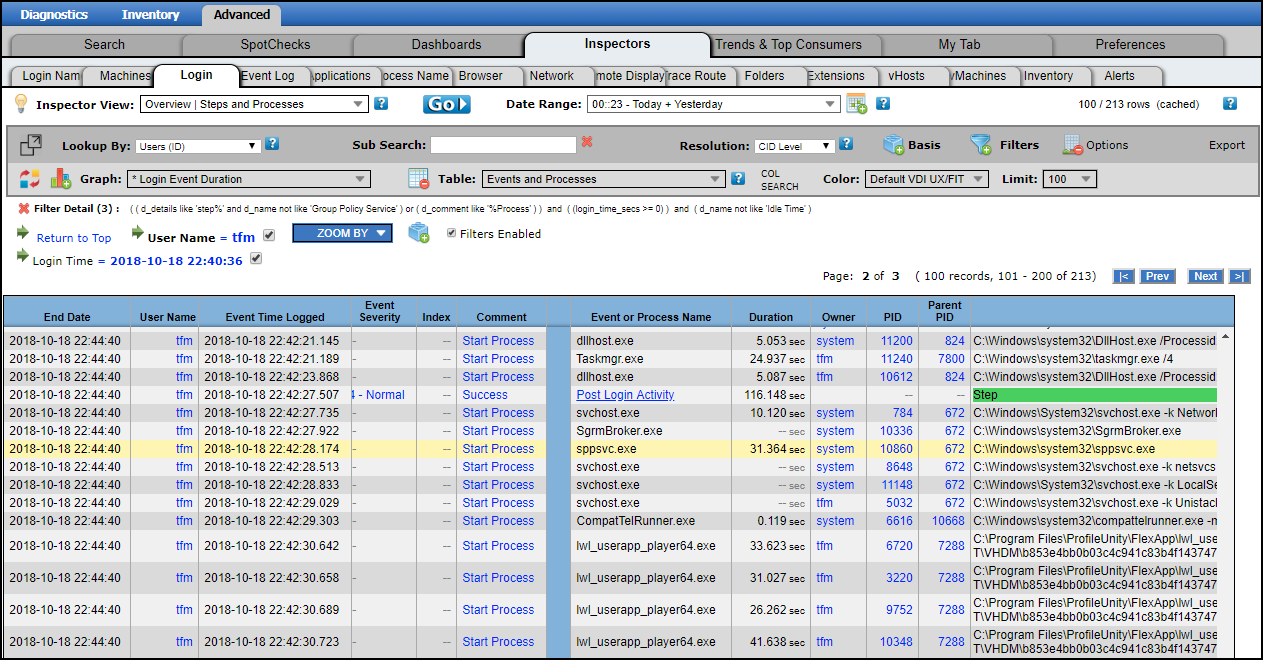
To view the order of what happened and how long each item took, click the Network Providers step in the login process and scroll through the data.
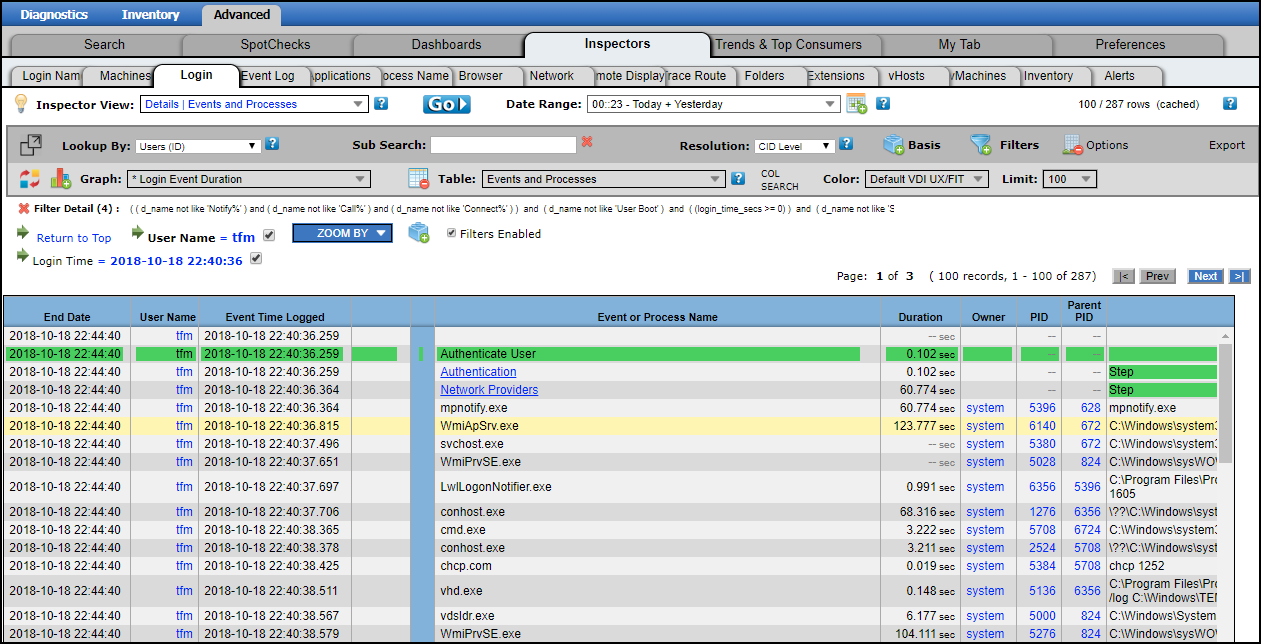
Clicking another step, in the image below Post Login Activity, shows a detailed breakdown of what is happening post-login.
