You can view a machine's history using the History Playback Mode feature of CommandCTRL. In History Playback Mode, you can view a 10-second sample of the machine's history every 3 seconds when using normal playback speed or a 10-second sample every 1 second when using high speed playback.
CommandCTRL only tracks machine statistics while the machine is being used. When the machine is turned off or when it is locked, no statistics are collected. Because of this, the history you see might include gaps corresponding to weekends, holidays, or times during the day when the machine was not being used.
Note: When using the History Playback Mode of a machine, all times displayed are determined by the local time of the Agent, not the local time of the end-user's machine. So when CommandCTRL users are trying to review events that occurred on machines in other time zones, the CommandCTRL users must calculate what time the event happened in his or her local time. For example, to find an event that happened at noon in Honolulu, a CommandCTRL user accessing an Agent based in New York City would need to view the 6pm block of the timeline because Honolulu is six hours behind New York City.
To access the history of a machine, complete the following steps:
-
In the side navigation panel, go to Inventory > Machines.
-
On the Machines screen that appears, locate the machine whose history you want to view, then either click the:
-
Name of the machine.
-
Right-arrow
 icon located to the far right of the machine.
The dashboard for that machine appears.
-
-
In the top right corner of the machine dashboard, click the
 (Real-Time Mode On) icon in order to switch Real-time Mode off and to turn History Playback Mode on.
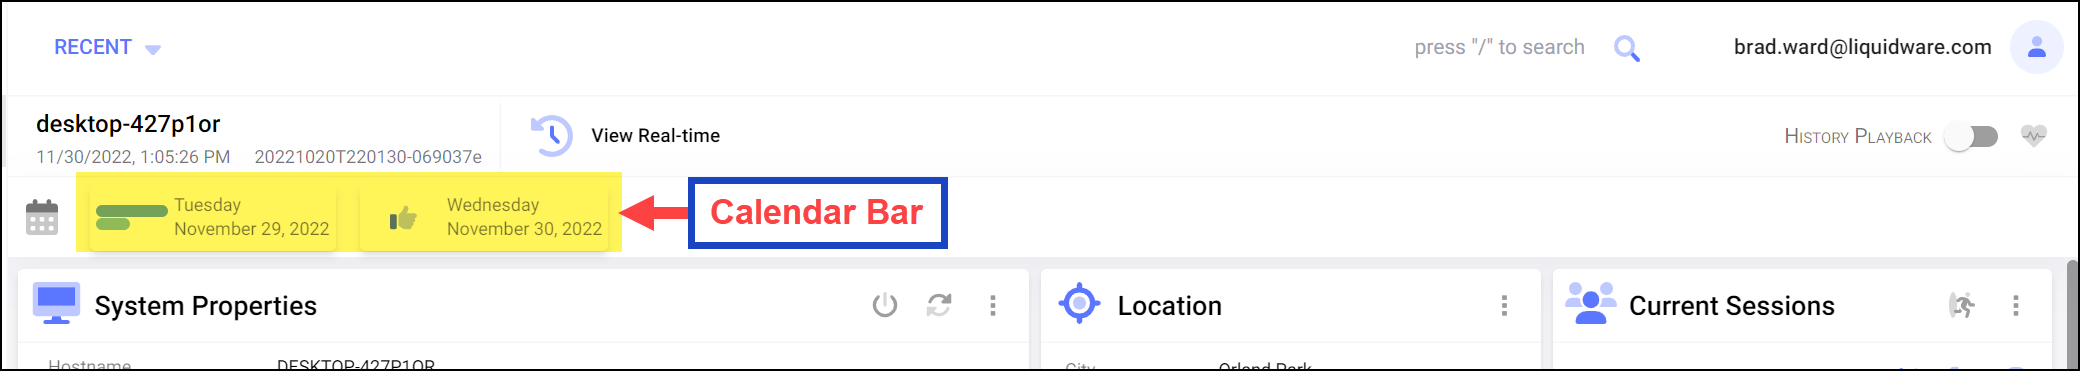
 When History Playback Mode is turned on, a calendar bar appears below the machine name on the dashboard.
-
If the calendar bar already displays the date you want to review, click the date. Otherwise, click the
 (Calendar) icon on the left side of the calendar bar and then use the popup calendar screen to select another date range.
 -
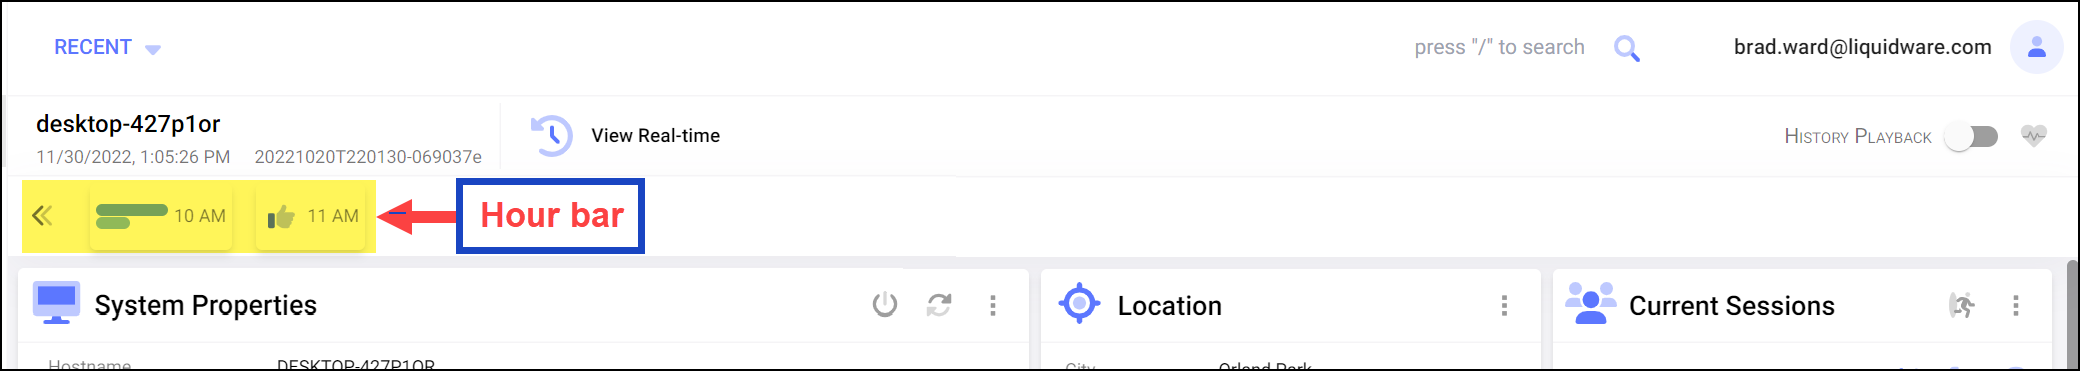
After you select a date, the calendar bar is replaced by an hour bar that shows all of the hours within the date you selected that you can review the history of. Click one of the hour blocks.
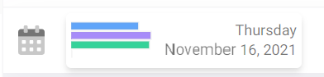
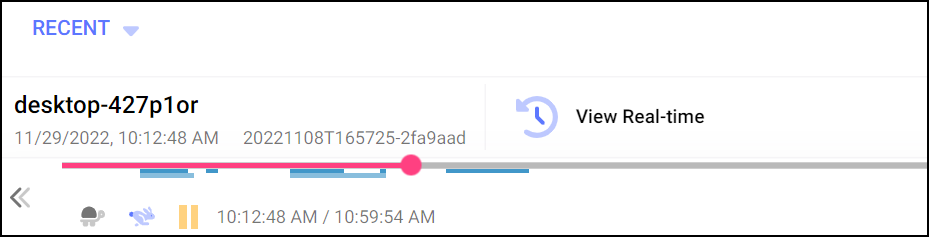
If there were incidents during the hour block you selected, a color-coded bar or set of bars appears in the hour field.
Color Incident Type Blue CPU Red Network Purple RAM Green Disk The length of the bar represents the approximate amount of time during the hour that the incident occurred.
In the example below, a CPU incident occurred for approximately 50 minutes of the hour block, while RAM and disk incidents occurred for the whole hour.
-
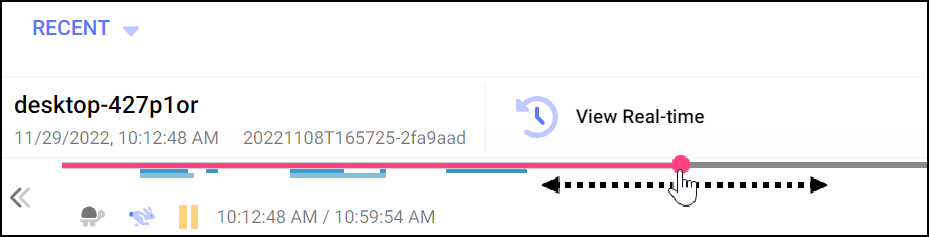
After you click an hour bar, it disappears and is replaced by a video control bar.
This video control bar contains the following elements:
-
A progress bar
-
A
 (Playback: Slow) button — Clicking this button then clicking the Play button causes the recording to display 10 seconds of machine history every 3 seconds.
 -
A
 (Playback: Fast) button — Clicking this button then clicking the Play button causes the recording to display 10 seconds of machine history every second.
 -
A
 (Play) button — Clicking this button causes the recording to begin playing at whatever playback speed you selected.
 -
A
 (Pause) button — Clicking this button pauses the recording. Note that the Pause button only appears after video playback has started.
As the progress bar advances, the statistics in all the fields below will continue to update.
-
-
To jump to a particular point in time within the hour, click and hold the progress bar circle and drag it to the left or to the right.