Stratusphere’s Advanced Inspectors include browser-level metrics that provide visibility into your internet traffic. Stratusphere tracks metrics including domain/URL, page-level details, and date and time of activity to give a clearer picture of peaks in internet traffic and usage of cloud applications.
Stratusphere collects metrics from Microsoft Internet Explorer (versions 9.x and higher), Mozilla Firefox, and two Chrome-based browsers (versions 35 and higher): Google Chrome and Microsoft Edge Chromium.
The Liquidware Chrome extension can be used in both Google Chrome and Microsoft Edge Chromium. With older versions of Stratusphere, all Chrome-related browser activity displays as simply “Chrome.” Starting with Stratusphere 6.1.5, stats are differentiated so that browser activity using Google Chrome is labeled as “Chrome” and browser activity using Edge Chromium is labeled as “Edge.” You can view your browser statistics on the Advanced Inspectors Browser tab.
Configuring the CID Key to Collect Browser Metrics
- Make sure that the Connector ID Key has already been installed on the machine you are monitoring. If you have not already done so, download a CID Key installer from the Stratusphere Hub and install it on a machine that has either Chrome or Internet Explorer installed. Refer to the section of this document entitled Capturing Metrics from the Environment for additional information on installing the CID Key.
- Log in to the Hub Administration module and go to the Hub Administration > Connector ID Keys > Connector ID Key Properties tab and expand the Configure Metrics section.
- Select the Browser Metrics checkbox, then select which browser information to collect.
- Click Save to change the settings.
Browser Metrics for Chrome-Based Browsers
Liquidware has developed a Chrome Extension that is available within the Chrome Web Store called Liquidware Browser Monitor to be installed within Chrome-based browsers. This extension works in conjunction with the CID Key installed on the machine and collects detailed metrics, which are then packaged and uploaded by the CID Key to the Stratusphere Database. The same Chrome extension works on Google Chrome and Microsoft Edge Chromium.
Click the following link to add the Liquidware Browser Monitor to your browser:
https://chrome.google.com/webstore/detail/lwl-chrome-monitor/fcdgffmdaoiofonjahbdpglcdodgkaii
Enabling Browser Metrics in Google Chrome
Collecting browser metrics requires a few more steps, including configuring some GPO settings and installing the Liquidware Browser Monitor Extension in Google Chrome. After adding the Liquidware Browser Monitor from the link above, complete the following steps to capture Chrome metrics:
- Download and unzip the following policy templates zip file:
- https://cdn.liquidware.com/stratusphere/tools/policy_templates.zip
- Set the Local Group policy by completing the following sub-steps:
- Open
gpedit.mscand navigate to Computer Configuration > Administrative Templates. - Right-click Administrative Templates in the left tree view and click the Add/Remove templates option.
- In the new window, click the Add button.
- Browse to where you unzipped the ZIP file and select
windows/adm/en-US/chrome.adm. - Go to Computer Configuration > Administrative Templates > Classic Administrative Templates > Google > Google Chrome > Extension and double-click the Configure the list of force-installed extensions option.
- Select the Enable checkbox.
- Click the Show button.
- Copy the following string and paste it into first row, then save it and exit out of the Local Group Policy editor. Note that the seemingly random characters at the start of the string represent the ID of the extension in the Google Chrome store.
- Copy
fcdgffmdaoiofonjahbdpglcdodgkaii;https://clients2.google.com/service/update2/crx 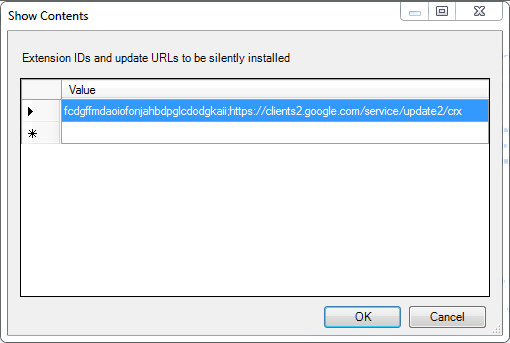
- Open
- Launch Google Chrome.
- In the address bar, navigate to
chrome://extensions/and verify that the Liquidware Browser Monitor is listed on the screen. - To verify that you are collecting browser statistics, look for a
stats.txtfile in the Connector ID folder. Note that it may take up to 5 minutes for this file to show up. Double-click it and search forbrowserStats. If it turns up in the search, you know that you are collecting Chrome statistics. If the search does not returnbrowserStats, contact Liquidware Support.
Enabling Browser Metrics in Microsoft Edge Chromium
Collecting browser metrics requires a few more steps, including configuring some GPO settings and installing the Liquidware Browser Monitor Extension in Microsoft Edge Chromium. After adding the Liquidware Browser Monitor from the link in the Browser Metrics for Chrome-Based Browsers section above, complete the following steps to capture Microsoft Edge Chrome metrics:
- Download and unzip the following policy templates zip file:
- https://cdn.liquidware.com/stratusphere/tools/MSEdgeTemplates.zip
- Set the Local Group policy by completing the following sub-steps:
- Open
gpedit.mscand navigate to Computer Configuration > Administrative Templates. - Right-click Administrative Templates in the left tree view and click the Add/Remove templates option.
- In the new window, click the Add button.
- Browse to where you unzipped the ZIP file and select
windows/adm/en-US/msedge.adm. - Go to Computer Configuration > Administrative Templates > Classic Administrative Templates (ADM) > Microsoft Edge > Extensions and double-click the Control which extensions are installed silently option.
- Select the Enable checkbox.
- Click the Show button.
- Copy the following string and paste it into first row. Save it and exit out of the Local Group Policy editor. Note that the seemingly random characters at the start of the string represent the ID of the extension in the Google Chrome store.
- Copy
logokckolciglldglehhhipnfjibinkl
- Open
- Launch Microsoft Edge Chromium.
- In the address bar navigate to
edge://extensionsand verify that the Liquidware extension Liquidware Browser Monitor for Chrome is listed on the screen. - To verify that you are collecting browser statistics, look for a
stats.txtfile in the Connector ID folder. Note that it may take up to 5 minutes (the default sampling frequency) for this file to show up. Double-click it and search forbrowserStats. If it turns up in the search, you know that you are collecting Chrome statistics. If the search does not returnbrowserStats, contact Liquidware Support.
Enabling Browser Metrics in Mozilla Firefox
The steps to enable collecting browser metrics in Mozilla Firefox are as follows:
Important: The Liquidware Browser Monitor for Mozilla Firefox extension requires Firefox version 109 or higher and only works with the CID Key version 6.7.0-x and higher.
- Download the following Mozilla Firefox Policy Template and unzip it into a folder:
- https://cdn.liquidware.com/stratusphere/tools/Mozilla-Firefox-Policy-Templates-v4.7.zip
- Navigate to the root of the unzipped folder and copy the
firefox.admxandmozilla.admxfiles into theC:\Windows\PolicyDefinitions\folder. -
Important: DO NOT create this folder if it does not exist. Instead, navigate to
%systemroot%\policyDefinitionsfolder.
- At the root of the folder, navigate to the
en-USfolder for US English or depending on your language requirements, you could choose any of the other language folders for localization. - Within the selected language folder, copy the
firefox.admlandmozilla.admlfiles and paste them into theC:\Windows\PolicyDefinitions\or the corresponding language folder within the%systemroot%\policyDeinitionsfolder. - Set the Local Group policy by completing the following sub-steps:
- Open
gpedit.mscand navigate to Computer Configuration > Administrative Templates > Mozilla > Firefox > Extensions. - Double-click on Extension Management. In the top left-hand corner of the window that pops up, click Enabled and copy-paste the following JSON string into the text field under Options:
- Copy
{
"firefox_monitor@liquidware.com": {
"installation_mode": "force_installed",
"install_url": "https://addons.mozilla.org/firefox/downloads/latest/liqudware-browser-monitor/latest.xpi"
}
}
- Open
- Launch Mozilla Firefox.
- In the address bar, navigate to
about:addonsand verify that the Liquidware extension Liquidware Browser Monitor for Firefox is listed on the screen. - To verify that you are collecting browser statistics, look for a
stats.txtfile in the Connector ID folder. -
Note: It may take up to 5 minutes (the default sampling frequency) for this file to show up. Double-click it and search for
browserStats. If it turns up in the search, you know that you are collecting Firefox statistics. If the search does not returnbrowserStats, contact Liquidware Support.